Handling Rate limiting and multi-region failover in Azure Cosmos DB Cassandra API
Topics covered in this lab include:
- Rate Limiting errors and how to handle them in your application
- How to achieve failover with multi-region Load Balancing
If this is your first lab and you have not already completed the setup for the lab content see the instructions for Account Setup before starting this lab.
Handling Rate Limiting errors
Overview
Azure Cosmos DB is a resource governed system and same is the case with the Cassandra API for Cosmos DB. This means you can do a certain number of operations in a given second based on the request units consumed by the operations. If an application exceeds that limit, the provisioned throughput will be exhausted leading to subsequent requests being rate-limited and exceptions being thrown. These are also called 429 errors that are returned when clients consume more resources (RU/s) than the amount that what has been provisioned.
What’s the best way to tackle these?
One of the ways you can resolve this is by increasing the RU/s and there is a spectrum of options for managing scale and provisioning throughput (RUs) in the Cassandra API.
But, you may want to handle these errors in the application itself. The good thing is that the Cassandra API in Azure Cosmos DB translates these exceptions (429 errors) to overloaded errors on the Cassandra native protocol and it is possible for the application to intercept and retry these requests.
For Java, you can do this using the Azure Cosmos DB extension for Cassandra retry policy.
You can also use the Spark extension to handle rate-limiting.
The sample application used to demonstrate the concepts is a REST API service built with the Spring Data Cassandra. It exposes a REST endpoint for clients to POST orders which are then persisted to Cassandra tables in Cosmos DB.
Pre-requisites
- Create keyspace called
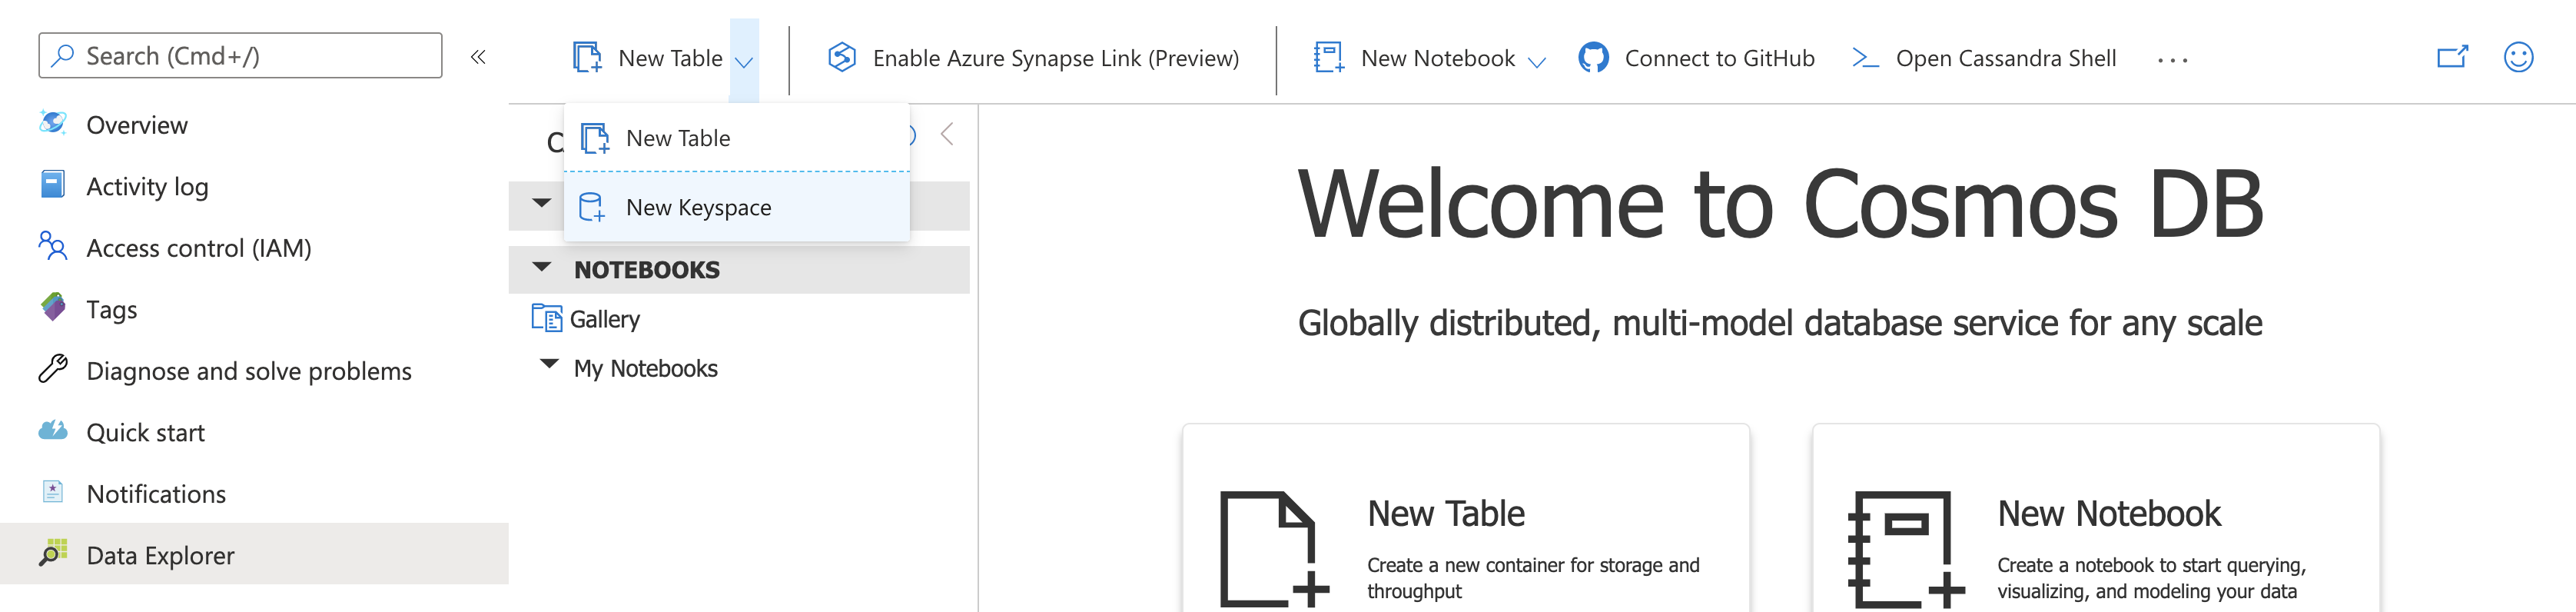
ordersappin CosmosDB. In the Azure Portal, open your Cosmos DB account, select Data Explorer. From the New Table menu, choose New Keyspace
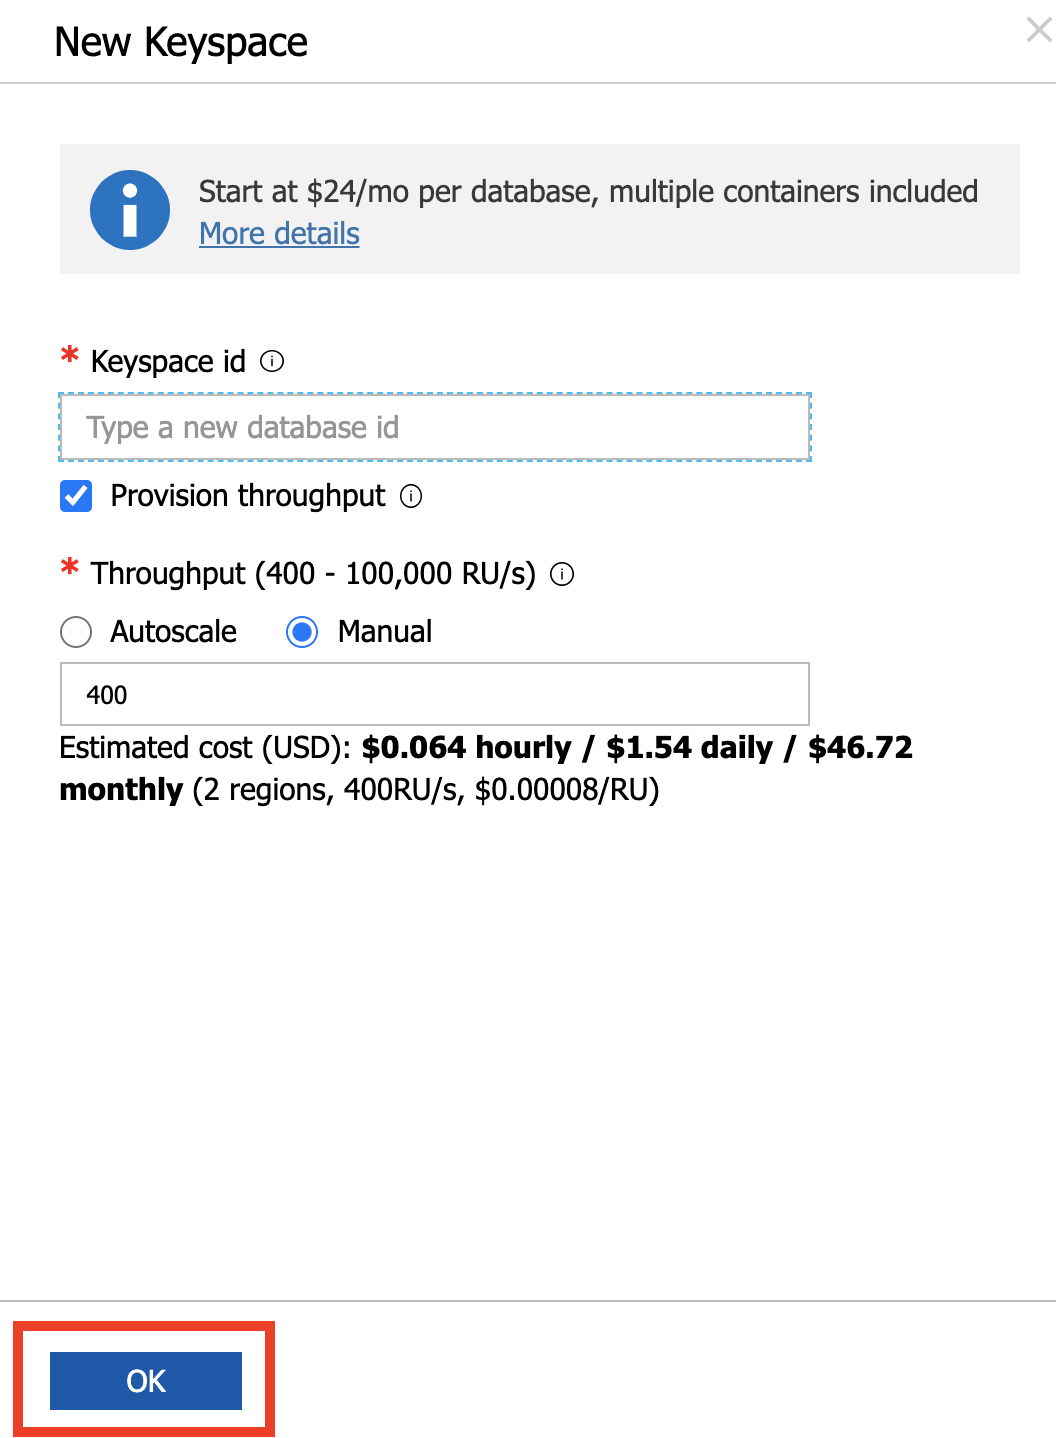
Enter ordersapp as the name and click OK to proceed.
- Install hey, a load testing program.
You are free to use any tool of your choice for load testing e.g. JMeter. The tool should be capable of invoking an HTTP endpoint
To install hey from source:
- Install Go - https://golang.org/dl/
cd $GOPATH- get the source -
go get github.com/rakyll/hey - change into the directory -
cd github.com/rakyll/hey - create an executable specific to your OS:
GOOS=windows GOARCH=amd64 go build -o ./bin/hey
GOOS=linux GOARCH=amd64 go build -o ./bin/hey
GOOS=darwin GOARCH=amd64 go build -o ./bin/hey
This should create a binary (name hey) in the bin folder of the current directory. You can move it anywhere in the file system
You can download OS specific binaries from these links, but please refer to https://github.com/rakyll/hey#installation for latest information:
- Linux 64-bit: https://storage.googleapis.com/hey-release/hey_linux_amd64
- Mac 64-bit: https://storage.googleapis.com/hey-release/hey_darwin_amd64
- Windows 64-bit: https://storage.googleapis.com/hey-release/hey_windows_amd64
Configure and setup Orders API service
Clone the repository
git clone https://github.com/TheovanKraay/cassandra-workshops/
Update the application.properties located in cassandra-wokrshops/labs/java/solutions/Lab03/orders-spring-data/src/main/resources to include info for your Cosmos DB account.
spring.data.cassandra.keyspace-name=ordersapp
spring.data.cassandra.schema-action=CREATE_IF_NOT_EXISTS
spring.data.cassandra.ssl=true
spring.data.cassandra.contact-points=<cosmos account name>.cassandra.cosmos.azure.com
spring.data.cassandra.port=10350
spring.data.cassandra.username=<cosmos account name>
spring.data.cassandra.password=<cosmos access key>
#ssl_keystore_file_path=<path to keystore e.g. /Library/Java/JavaVirtualMachines/jdk1.8.0_221.jdk/Contents/Home/jre/lib/security/cacerts>
#ssl_keystore_password=<keystore password>
#cosmos_retry_read_dc=East US 2
#cosmos_retry_write_dc=East US
Note on optional fields:
-
ssl_keystore_file_path: Enter the path to your keystore file. The default value is<JAVA_HOME>/jre/lib/security/cacerts -
ssl_keystore_password: Enter the keystore password. The default value ischangeit -
cosmos_retry_read_dc- Cosmos DB region for read. Default value isWest US -
cosmos_retry_write_dc- Cosmos DB region for write. Default value isWest US
To start the application:
cd cassandra-workshops/labs/java/solutions/Lab03/orders-spring-data
mvn clean package
java -jar target/orders-spring-data-0.1.0-SNAPSHOT.jar
The
orderstable will be automatically created when the service is started for the first time
To test the application, invoke the REST endpoint to create a few orders:
curl -X POST -H "Content-Type: application/json" -d '{"amount":"150", "location":"New York"}' http://localhost:8080/orders
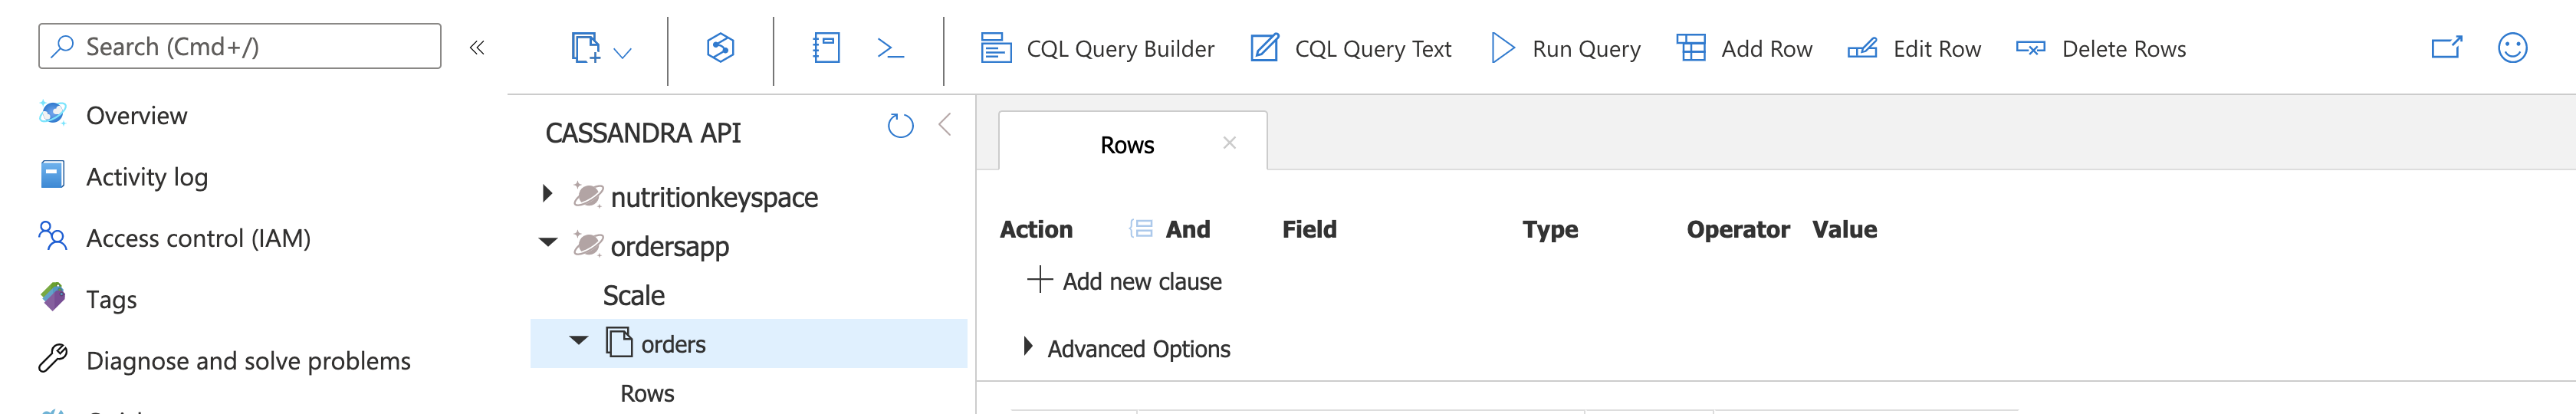
Confirm that the order data was stored in Cassandra. Go to your Cosmos DB account, choose Data Explorer, select ordersapp > orders > Rows
You are all set to try out various scenarios
Scenarios
First attempt
To start with, confirm the number of rows in the orders table. Open the Cassandra Shell in the Cosmos DB portal and execute the below query:
select count(*) from ordersapp.orders;

 system.count(*)
-----------------
    1

(1 rows)
Your results might differ
In a different terminal, start load test:
hey -t 0 -m POST -H "Content-Type: application/json" -d '{"amount":"100", "location":"load_test_1"}' http://localhost:8080/orders
This will invoke the REST endpoint with 200 requests. This is enough to overload the system since we only have 400 RU/s provisioned as of now.
Notice the logs in the application terminal. In the beginning, you will see that the orders are being created successfully. For e.g.
Added order ID 25a8cec1-e67a-11ea-9c17-7f242c2eeac0
Added order ID 25a8f5ef-e67a-11ea-9c17-7f242c2eeac0
Added order ID 25a8f5ea-e67a-11ea-9c17-7f242c2eeac0
.....
After a while, when the RU/s (throughput) degrades and finally exceeds the provsioned limit, Cosmos DB will rate-limit the application requests. This will manifest itself in the form of an exception which will look similar to this:
WARN 50437 --- [r1-nio-worker-2] com.datastax.driver.core.RequestHandler : Host foobar-cassandra.cassandra.cosmos.azure.com/104.45.144.73:10350 is overloaded.
You will see several of these exceptions followed by success messages which you saw earlier. What was the end result? The load test tried to create 200 orders. Let’s check the final numbers. Open the Cassandra Shell in the Cosmos DB portal and execute the same query
select count(*) from ordersapp.orders;

 system.count(*)
-----------------
    201
You should see 200 additional rows (orders) have been inserted. This was made possible by the Retry Policy which we configured using the Azure Cosmos DB extension
...
//time in milliseconds
private static final int FIXED_BACK_OFF_TIME = 5000;
private static final int GROWING_BACK_OFF_TIME = 1000;
private static final int MAX_RETRY_COUNT = 20;

CosmosRetryPolicy retryPolicy = new CosmosRetryPolicy(MAX_RETRY_COUNT, FIXED_BACK_OFF_TIME, GROWING_BACK_OFF_TIME);
...
Switch back to the load testing terminal and check output statistics.
Summary:
  Total:        12.1823 secs
  Slowest:      10.3017 secs
  Fastest:      0.2374 secs
  Average:      3.0012 secs
  Requests/sec: 16.4172

  Total data:   10400 bytes
  Size/request: 52 bytes

Response time histogram:
  0.237 [1]     |■
  1.244 [77]    |■■■■■■■■■■■■■■■■■■■■■■■■■■■■■■■■■■■■■■■■
  2.250 [50]    |■■■■■■■■■■■■■■■■■■■■■■■■■■
  3.257 [22]    |■■■■■■■■■■■
  4.263 [0]     |
  5.270 [0]     |
  6.276 [0]     |
  7.282 [0]     |
  8.289 [22]    |■■■■■■■■■■■
  9.295 [0]     |
  10.302 [28]   |■■■■■■■■■■■■■■■


Latency distribution:
  10% in 0.2460 secs
  25% in 0.2569 secs
  50% in 1.3891 secs
  75% in 7.3559 secs
  90% in 10.2265 secs
  95% in 10.2399 secs
  99% in 10.2902 secs

Details (average, fastest, slowest):
  DNS+dialup:   0.0023 secs, 0.2374 secs, 10.3017 secs
  DNS-lookup:   0.0015 secs, 0.0000 secs, 0.0060 secs
  req write:    0.0001 secs, 0.0000 secs, 0.0022 secs
  resp wait:    2.9987 secs, 0.2373 secs, 10.3016 secs
  resp read:    0.0001 secs, 0.0000 secs, 0.0013 secs

Status code distribution:
  [200] 200 responses
The numbers will differ for your specific case depending upon multiple factors. But let’s draw our attention to the following:
- We clocked at
16.4172 Requests/secfor200requests over a total execution time of12.1823secs - On an
Averageeach request took3.0012secs - See the
Latency distributionto take a look latency numbers - Another important metric is the
Status code distribution-[200] 200 responses. This shows that at the end, our application responded with a HTTP 200 for all our requests (recall that we sent 200 requests
The takeaway is that all the 200 orders were successfully stored in Cosmos DB inspite of the rate-limiting errors, is because our application code transparently retried them based on the policy
(Optional) Repeat the test with a lower number of requests
You can repeat the same test with a lower number of requests (one which will not breach the provisioned throughput). For example:
hey -t 0 -n 60 -m POST -H "Content-Type: application/json" -d '{"amount":"100", "location":"load_test_1"}' http://localhost:8080/orders
-n 60will send 60 requests
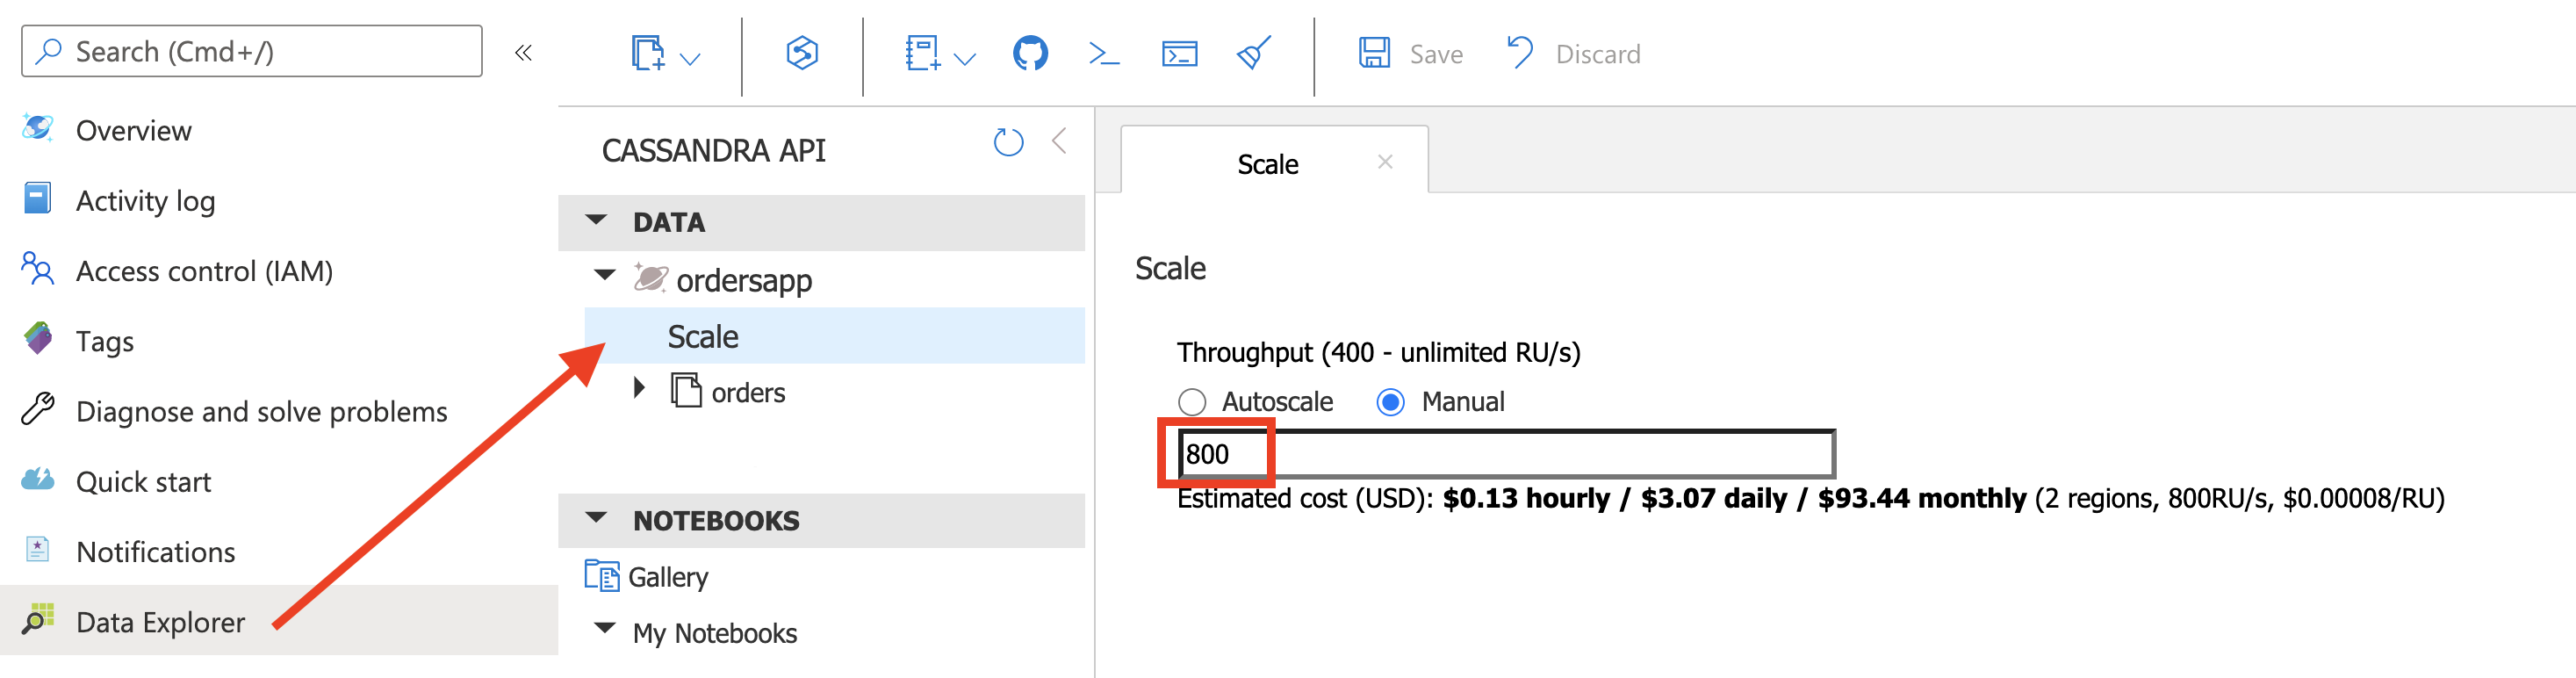
(Optional) Increase provisioned throughput
You can increase the Request Units using the Azure Portal (for e.g. double it to 800 RU/s) and run the same load test
hey -t 0 -m POST -H "Content-Type: application/json" -d '{"amount":"100", "location":"load_test_1"}' http://localhost:8080/orders
You will not see the 429 errors now and relatively low numbers for latency, requests per second etc.
Try increasing the no. of requests (using
-nflag) to see when the throughput threshold is breached for the application to get rate limited
Deactivate Retry Policy
Update the code sample to comment out the part where the Retry Policy is configured. Modify Utils.java in cassandra-workshops/labs/java/solutions/Lab03/orders-spring-data/src/main/java/com/microsoft/azure/samples/spring/ folder
Stop the app, re-build the app and restart it:
mvn clean package
java -jar target/orders-spring-data-0.1.0-SNAPSHOT.jar
Before running the load test again:
- Note down the no. of rows in the orders table using
select count(*) from ordersapp.orders; - If you had increased the provisioned throughput for the previous section, please ensure that you dial it back down to 400 RU/s
hey -t 0 -m POST -H "Content-Type: application/json" -d '{"amount":"100", "location":"load_test_2"}' http://localhost:8080/orders
In the application logs, you will notice errors:
....
WARN 27735 --- [r1-nio-worker-1] com.datastax.driver.core.RequestHandler  : Host foobar-cassandra.cassandra.cosmos.azure.com/104.45.144.73:10350 is overloaded.
ERROR 27735 --- [io-8080-exec-10] o.a.c.c.C.[.[.[/].[dispatcherServlet]    : Servlet.service() for servlet [dispatcherServlet] in context with path [] threw exception [Request processing failed; nested exception is org.springframework.data.cassandra.CassandraConnectionFailureException: SessionCallback; CQL [INSERT INTO orders (amount,id,location,time) VALUES ('100',ef306790-e3a4-11ea-ae52-8d4bf6bb6bc7,'load_test_2','2020-08-21T11:53:31.529Z');]; All host(s) tried for query failed (tried: foobar-cassandra.cassandra.cosmos.azure.com/104.45.144.73:10350 (com.datastax.driver.core.exceptions.OverloadedException: Queried host (foobar-cassandra.cassandra.cosmos.azure.com/104.45.144.73:10350) was overloaded: Request rate is large: ActivityID=6b0462b8-eb12-4e09-8aec-c052e2c1bd47, RetryAfterMs=500, Additional details='Response status code does not indicate success: TooManyRequests (429); Substatus: 3200; ActivityId: 6b0462b8-eb12-4e09-8aec-c052e2c1bd47; Reason: ({
  "Errors": [
    "Request rate is large. More Request Units may be needed, so no changes were made. Please retry this request later. Learn more: http://aka.ms/cosmosdb-error-429"
  ]
});)); nested exception is com.datastax.driver.core.exceptions.NoHostAvailableException: All host(s) tried for query failed (tried: foobar-cassandra.cassandra.cosmos.azure.com/104.45.144.73:10350 (com.datastax.driver.core.exceptions.OverloadedException: Queried host (foobar-cassandra.cassandra.cosmos.azure.com/104.45.144.73:10350) was overloaded: Request rate is large: ActivityID=6b0462b8-eb12-4e09-8aec-c052e2c1bd47, RetryAfterMs=500, Additional details='Response status code does not indicate success: TooManyRequests (429); Substatus: 3200; ActivityId: 6b0462b8-eb12-4e09-8aec-c052e2c1bd47; Reason: ({
  "Errors": [
    "Request rate is large. More Request Units may be needed, so no changes were made. Please retry this request later. Learn more: http://aka.ms/cosmosdb-error-429"
  ]
});))]
....
In the terminal where you ran the load test, at the end of the output summary, you will see that some the requests failed to complete successfully i.e. they returned a response other than HTTP 200
...
Status code distribution:
  [200] 140 responses
  [500] 60 responses
Please note that these results are random and will differ in your case
In this case, the application got a non-200 response for 60 requests. This means that 60 out of 200 orders were not stored in Cosmos DB table. You can easily confirm this by counting the no. rows (select count(*) from ordersapp.orders;) and comparing it with the previous count.
Because we had deactivated the Retry Policy, our application no longer retried the requests that failed due to rate-limited errors. The exceptions received from the Cassandra driver were intercepted and re-throw by the Azure Cosmos DB extensions library.
How does retry work behind the scenes?
In-depth explanation of is out of scope of this lab. Please consult the source code for the Azure Cosmos DB extension for Cassandra Retry Policy if you want to understand how it is implemented.
In a nutshell, the retry policy handles errors such as OverLoadedError (which may occur due to rate limiting), and parses the exception message to use RetryAfterMs field provided from the server as the back-off duration for retries. If RetryAfterMs is not available, it defaults to an exponential growing back-off scheme. In this case the time between retries is increased by a growing back off time (default: 1000 ms) on each retry, unless maxRetryCount is -1, in which case it backs off with a fixed duration. It is important to handle rate limiting in Azure Cosmos DB to prevent errors when provisioned throughput has been exhausted.
Failover and Load Balancing
This part covers the following scenarios:
- Manual failover with Global endpoint load balancing
- Load balancing for specific read and write DC
- Correlation between data locality and latency
Manual failover with Global endpoint load balancing
Pre-requisites
Configure your Cosmos DB account for multi-region (single master). Open your Cosmos DB account in Azure Portal, select Replicate data globally. Modify the regions configuration as per your choice
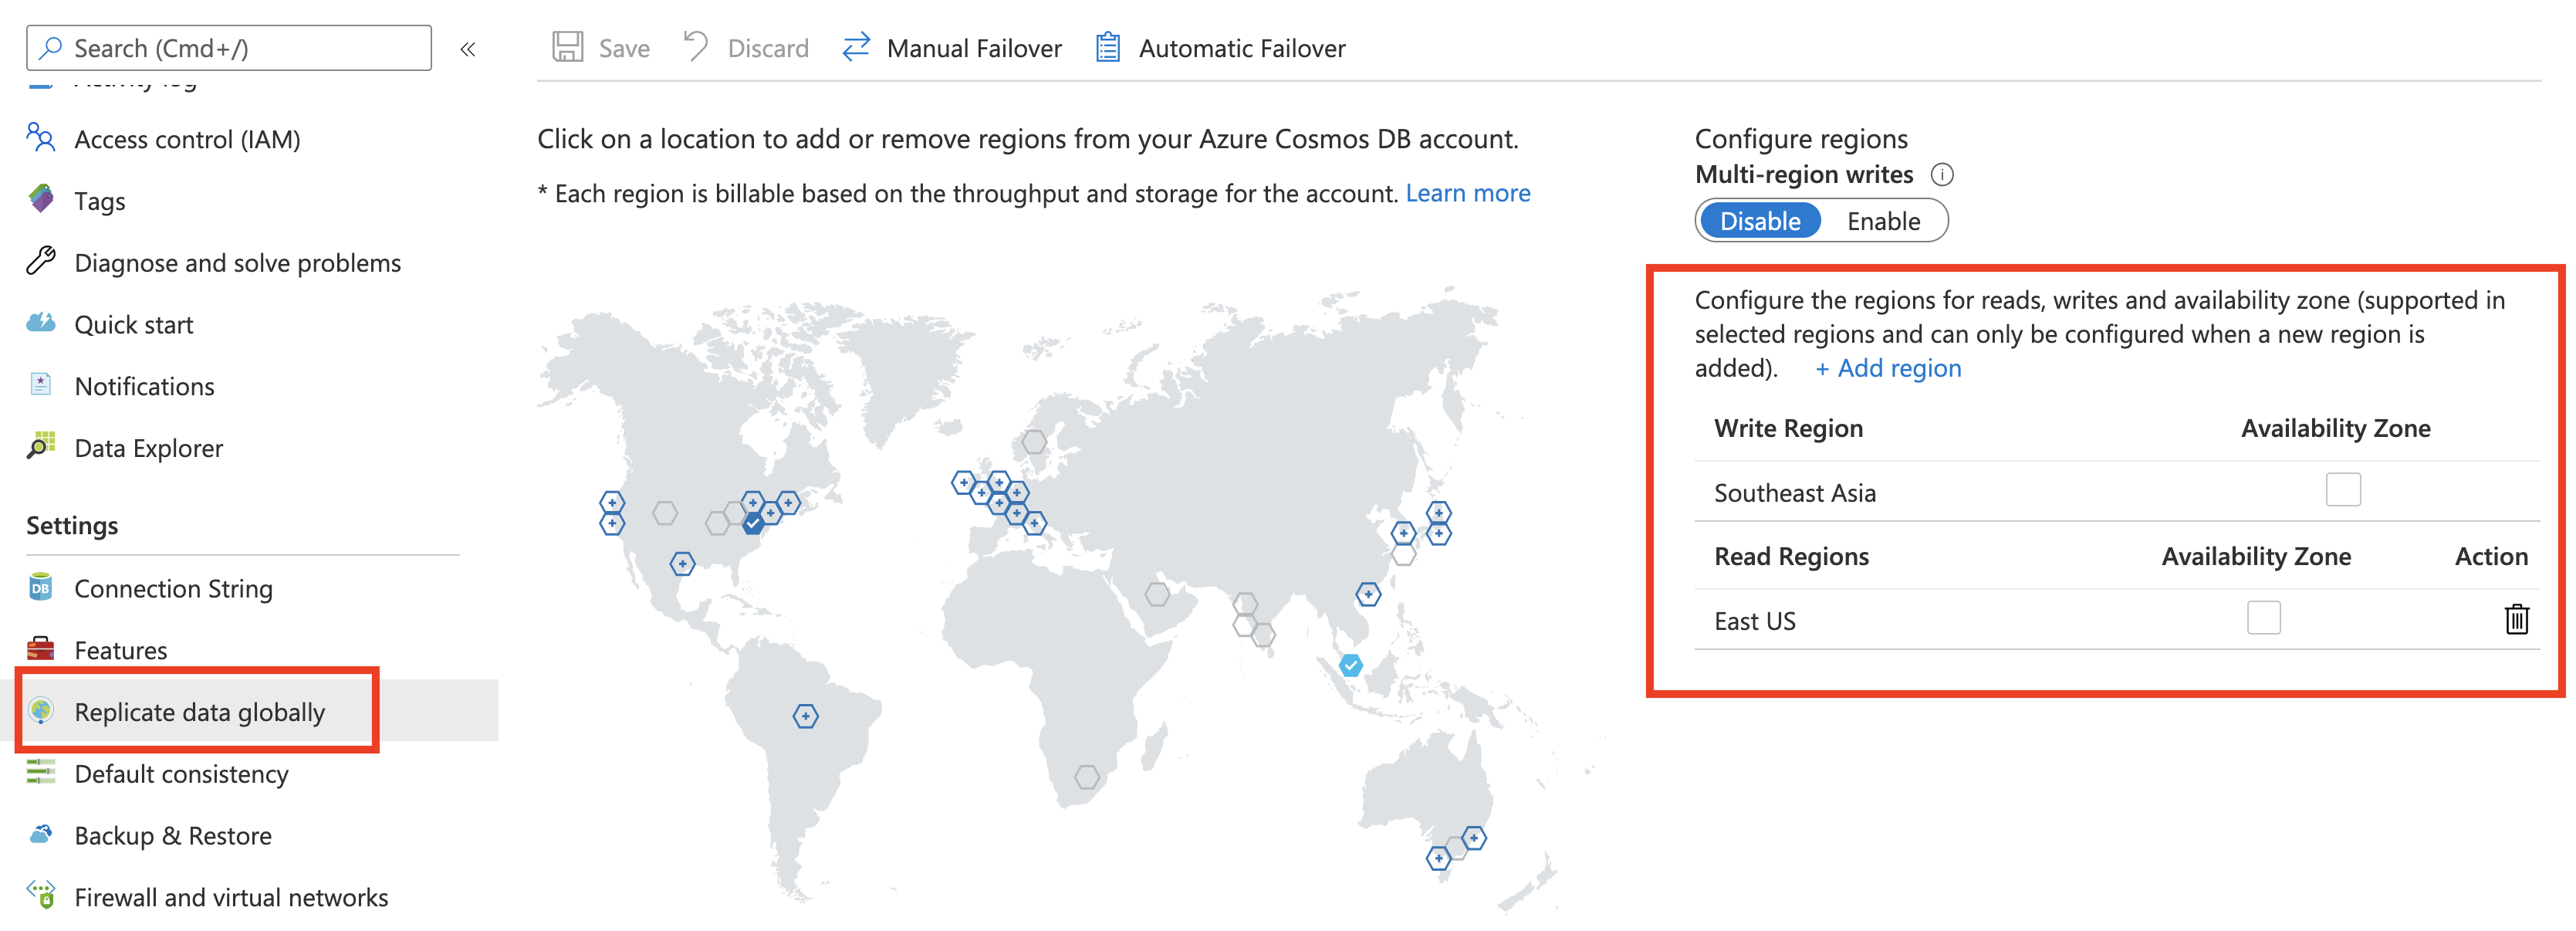
For example, I have configured Southeast Asia as the Write region and East US as the Read region.
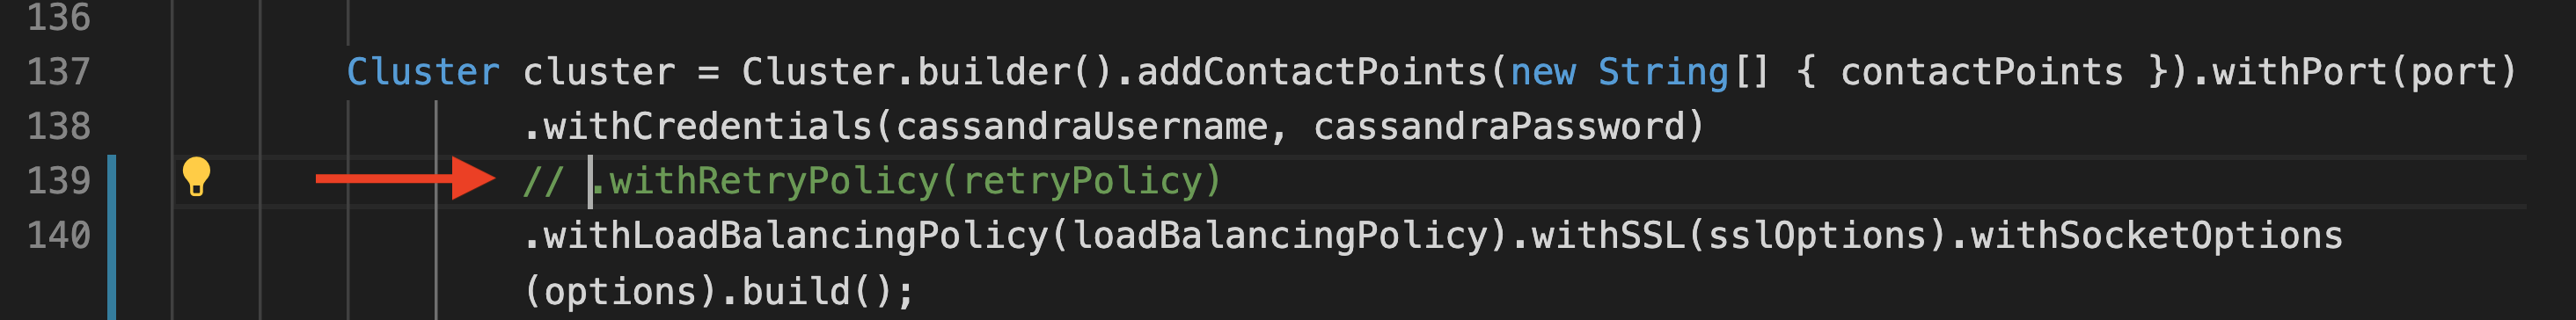
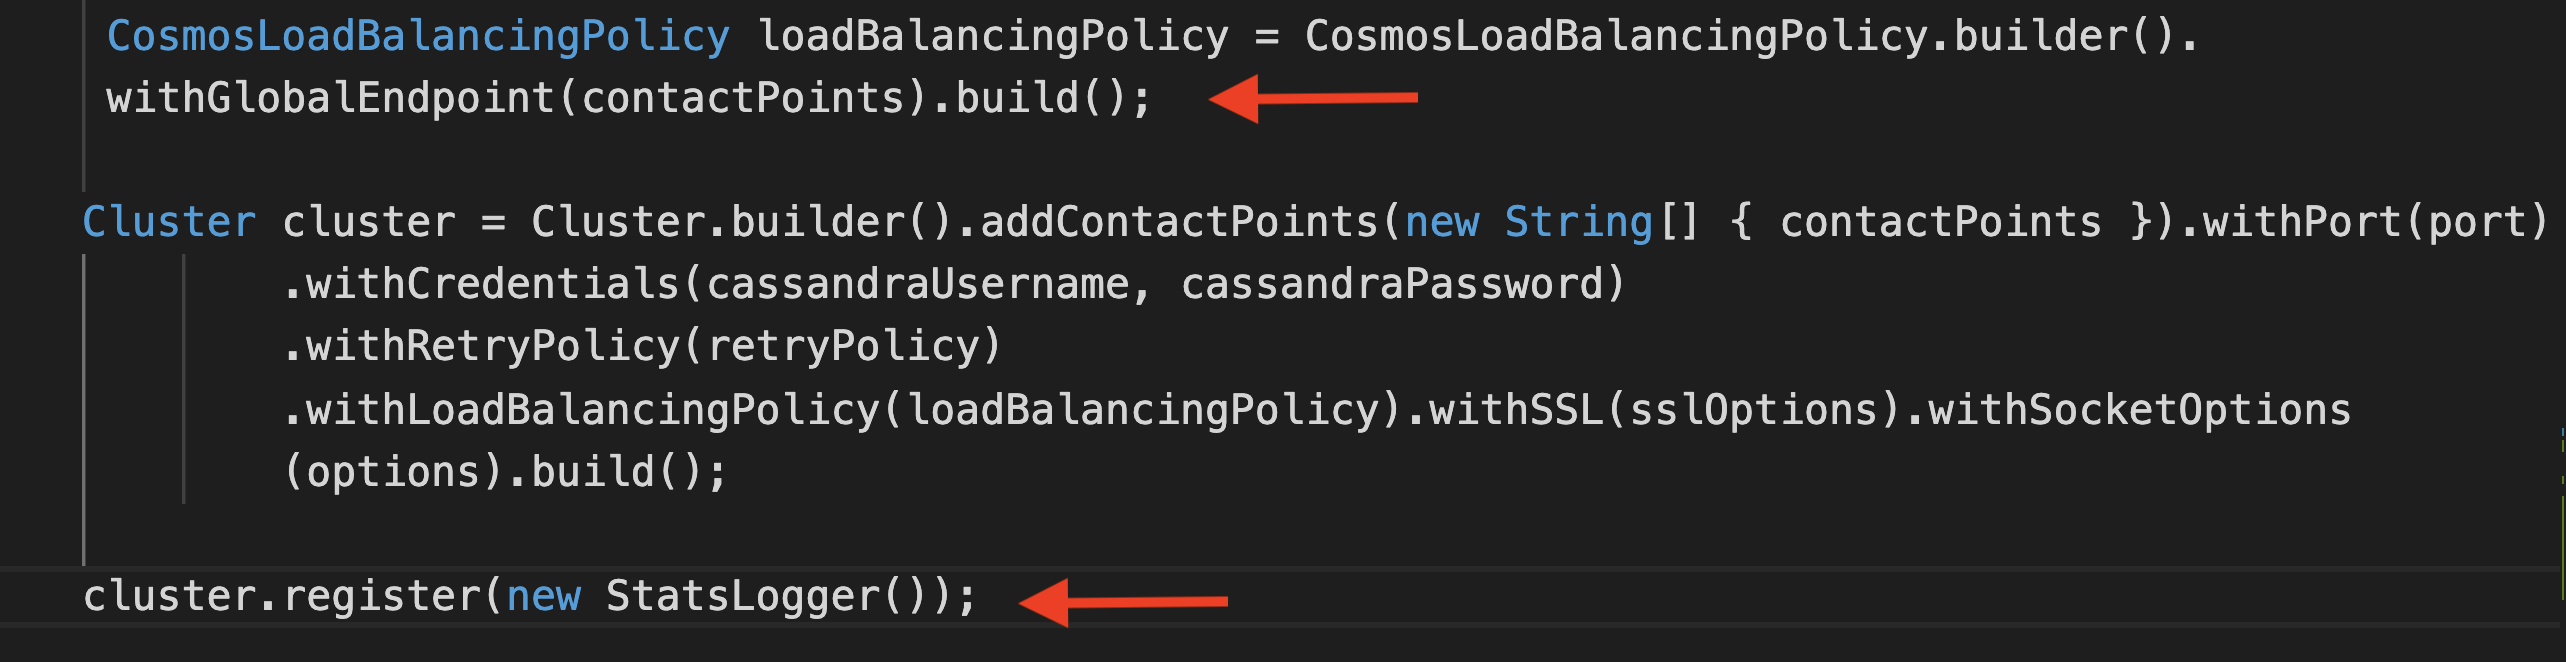
Update the code to ensure that:
- The right load balancing (global endpoint) is active
- The custom
LatencyTrackerimplementation is un-commented - it is used to log the datacenter (and related statistics) for each query
To start the application:
cd cassandra-workshops/labs/java/solutions/Lab03/orders-spring-data
mvn clean package
java -jar target/orders-spring-data-0.1.0-SNAPSHOT.jar
Insert a few records using the REST API endpoint
curl -X POST -H "Content-Type: application/json" -d '{"amount":"42", "location":"foo"}' http://localhost:8080/orders
In the logs, you should see:
*******Stats START********
data center - Southeast Asia
address - 52.230.23.170
Added order ID 3ca8b9e0-e85b-11ea-af17-4f997ed1313f
query - INSERT INTO orders (amount,id,location,time) VALUES ('42',3ca8b9e0-e85b-11ea-af17-4f997ed1313f,'foo','2020-08-27T11:48:34.559Z');
latency (in ms) - 186
*******Stats END********
*******Stats START********
data center - Southeast Asia
Added order ID 3e4b9470-e85b-11ea-af17-4f997ed1313f
address - 52.230.23.170
query - INSERT INTO orders (amount,id,location,time) VALUES ('42',3e4b9470-e85b-11ea-af17-4f997ed1313f,'foo','2020-08-27T11:48:37.303Z');
latency (in ms) - 88
*******Stats END********
....
Notice that the Southeast Asia region is being used for Write operations (as per configuration).
Test failover
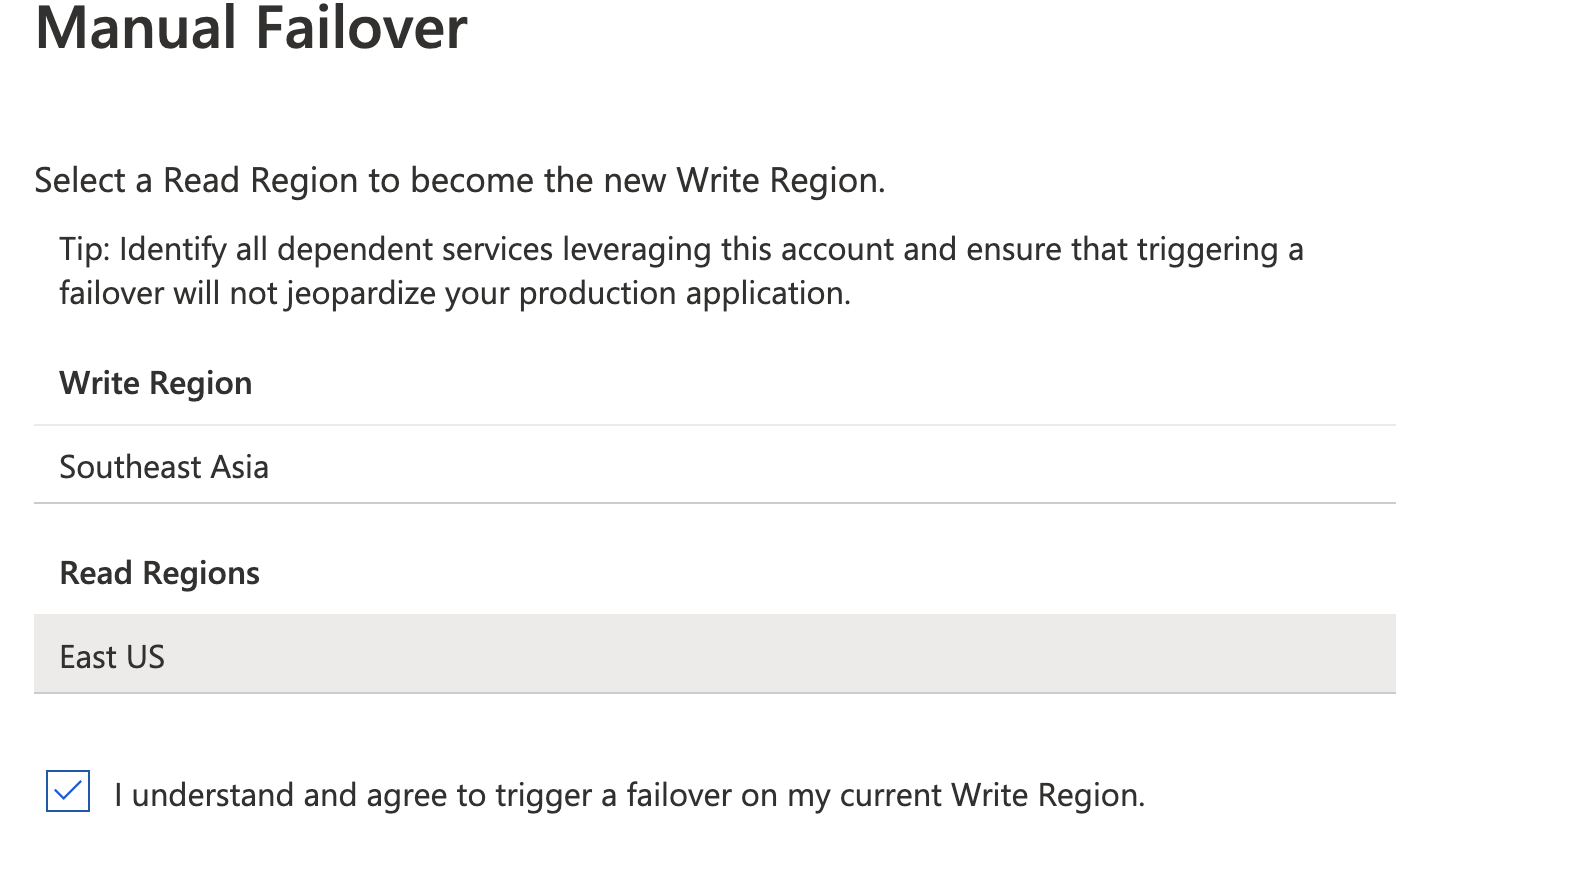
To initiate a failover, open your Cosmos DB account, choose Replicate data globally and Manual Failover
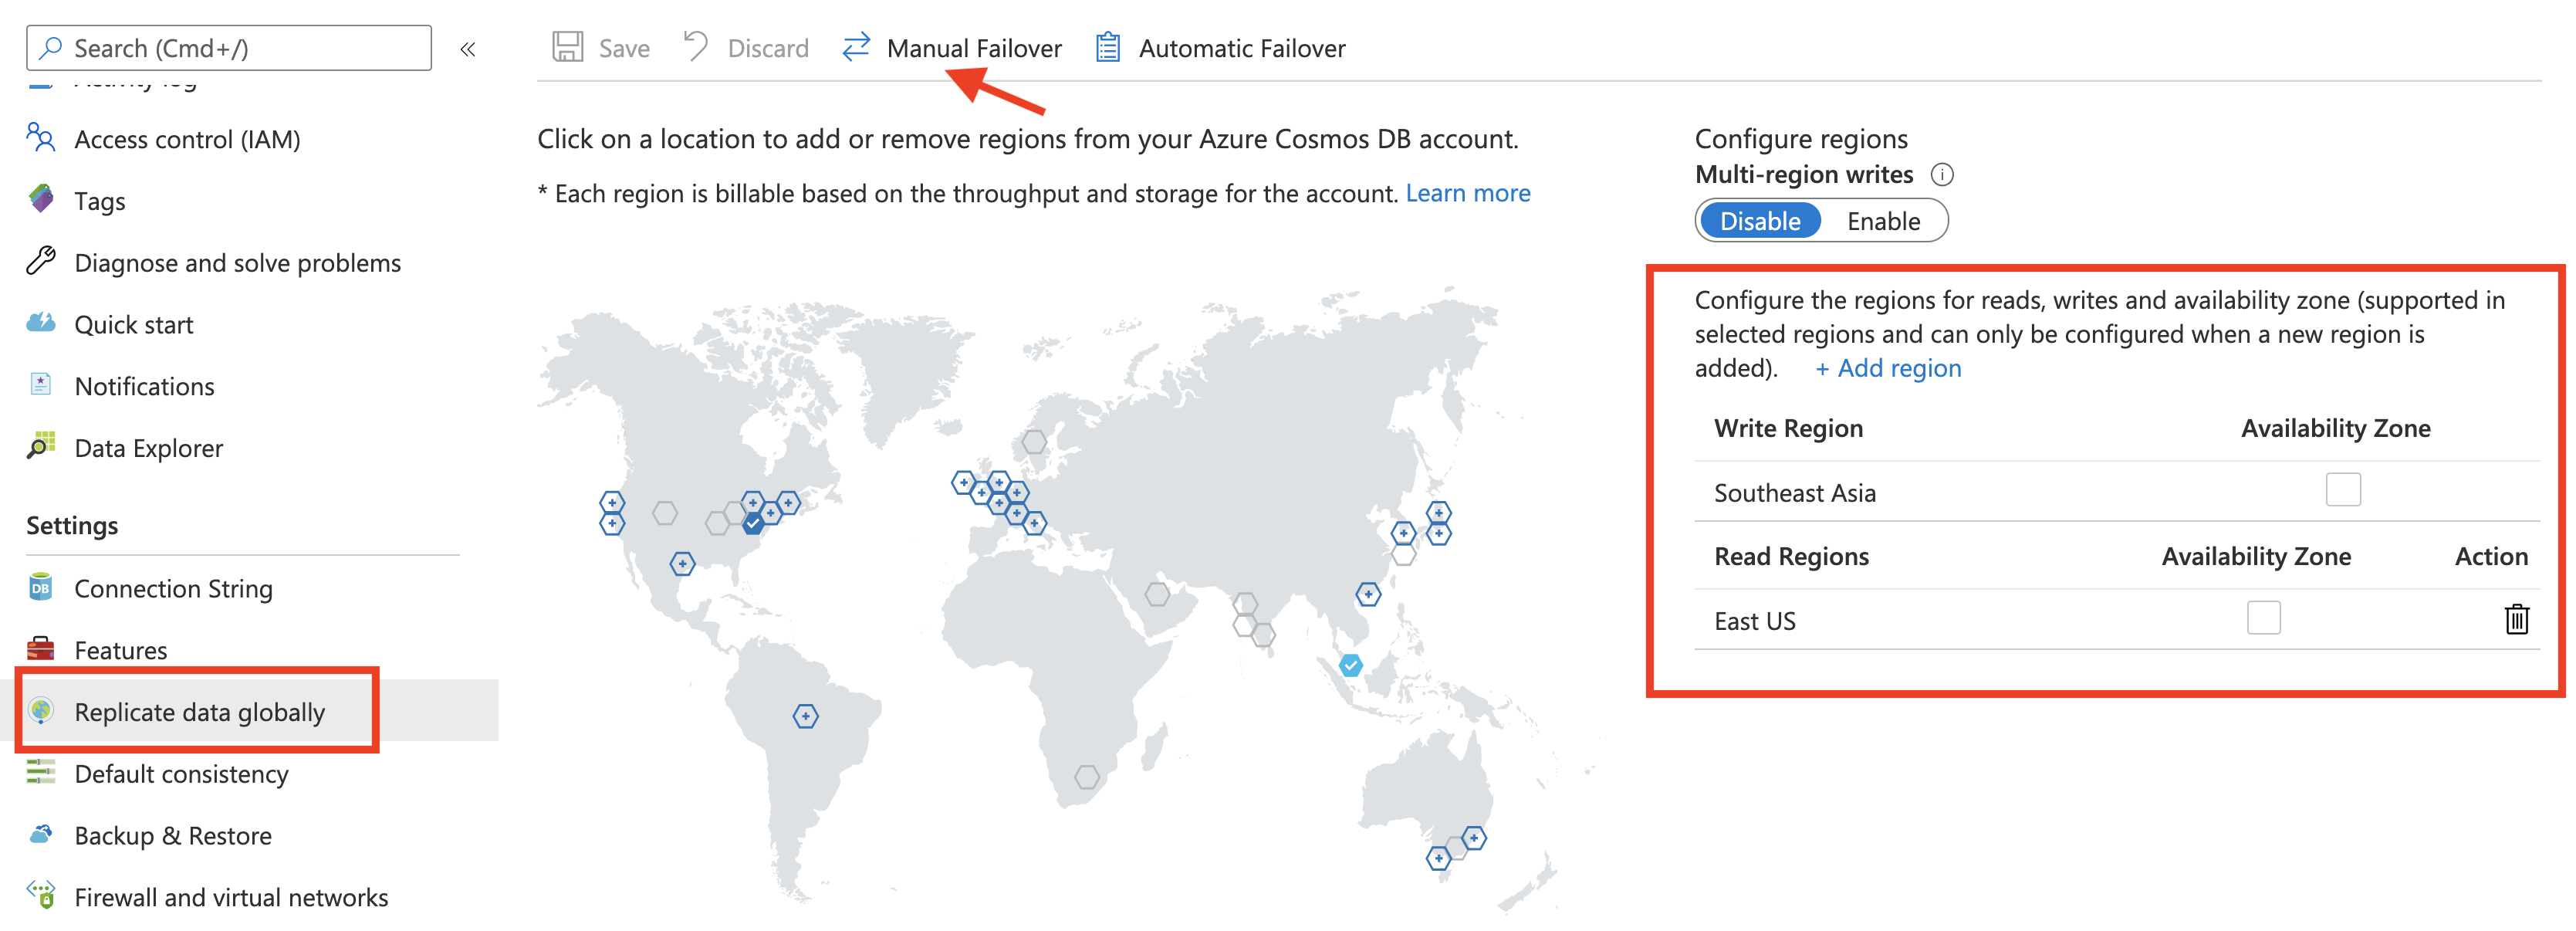
Configure the Read region as the Write region. Click Ok to confirm the changes.
For example, East US which was previously a Read region is being chosen as the Write region (replacing Southeast Asia).
Continue using the application to insert records. Since this is not a “proper region failure”, the writes will still be successful. You will notice that the application still continues to use the Southeast Asia region for the write requests.
Wait for the Manual Failover changes to take effect. As a soon as that happens (after a few seconds), the application will automatically select East US for write operations - this can be easily confirmed using the application logs since it outputs the data center for each query being executed
Here is the code snippet for custom LatencyTracker implementation:
    public static class StatsLogger implements LatencyTracker {

        @Override
        public void update(Host host, Statement statement, Exception exception, long newLatencyNanos) {
            System.out.println("*******Stats START********");
            System.out.println("data center - " + host.getDatacenter());
            System.out.println("address - " + new String(host.getAddress().getHostAddress()));
            System.out.println("query - " + statement.toString());
            System.out.println(
                    "latency (in ms) - " + TimeUnit.MILLISECONDS.convert(newLatencyNanos, TimeUnit.NANOSECONDS));
            System.out.println("*******Stats END********");

        }
    ....
Load balancing for specific read and write DC
In this section, you will see how you can re-direct read and write operations to the region of your choice by simply configuring the Load Balancing policy in your application.
Pre-requisites
Update application.properties with read and write regions.
...
cosmos_retry_read_dc=Southeast Asia
cosmos_retry_write_dc=East US
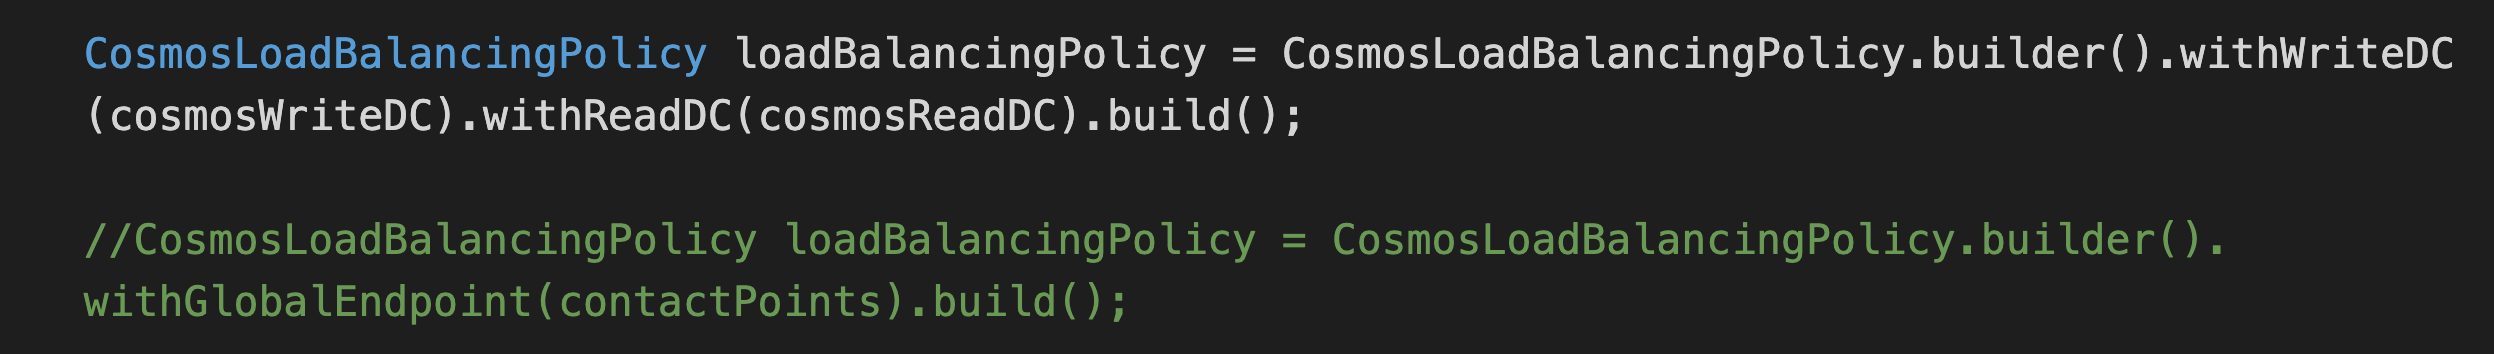
Update the load balancing strategy used in the code. Comment out the global endpoint policy and use the one based on read and write DC
To start the application:
cd cassandra-workshops/labs/java/solutions/Lab03/orders-spring-data
mvn clean package
java -jar target/orders-spring-data-0.1.0-SNAPSHOT.jar
Test Read/Write load balancing
Use the REST API to insert a record
curl -X POST -H "Content-Type: application/json" -d '{"amount":"42", "location":"foo"}' http://localhost:8080/orders

//output
Added order ID 4c4ea0e0-e85f-11ea-826e-65481f0c82a0
In the application logs, you can see that the Write operation was directed to East US (as per configuration)
*******Stats START********
data center - East US
Added order ID 4c4ea0e0-e85f-11ea-826e-65481f0c82a0
address - 104.45.144.73
query - INSERT INTO orders (amount,id,location,time) VALUES ('42',4c4ea0e0-e85f-11ea-826e-65481f0c82a0,'foo','2020-08-27T11:48:37.303Z');
latency (in ms) - 230
*******Stats END********
Use the order ID in the previous output to execute a read operation as such:
curl http://localhost:8080/orders/4c4ea0e0-e85f-11ea-826e-65481f0c82a0
You will get back the order details and more importantly, in the application logs, you can see that the read operation was directed to Southeast Asia region (as per current configuration)
Correlation between data locality and latency
In this section you will see what effect does data locality have on latency. Write operations have been used as an example, but the same is applicable for reads as well.
So far, you’ve been running the application from your machine. To test data locality, we will run our REST API service from the same region which has been configured as the Write region in your Cosmos DB account. Creating a VM in the same region is one of the options, but we will use Azure Cloud Shell to keep things simple.
Setup and configure Azure Cloud Shell
Open shell.azure.com in your browser and choose the the same region as the one you designated for writes.
Launch Cloud Shell from the top navigation of the Azure portal.
![]()
Select the Bash environment

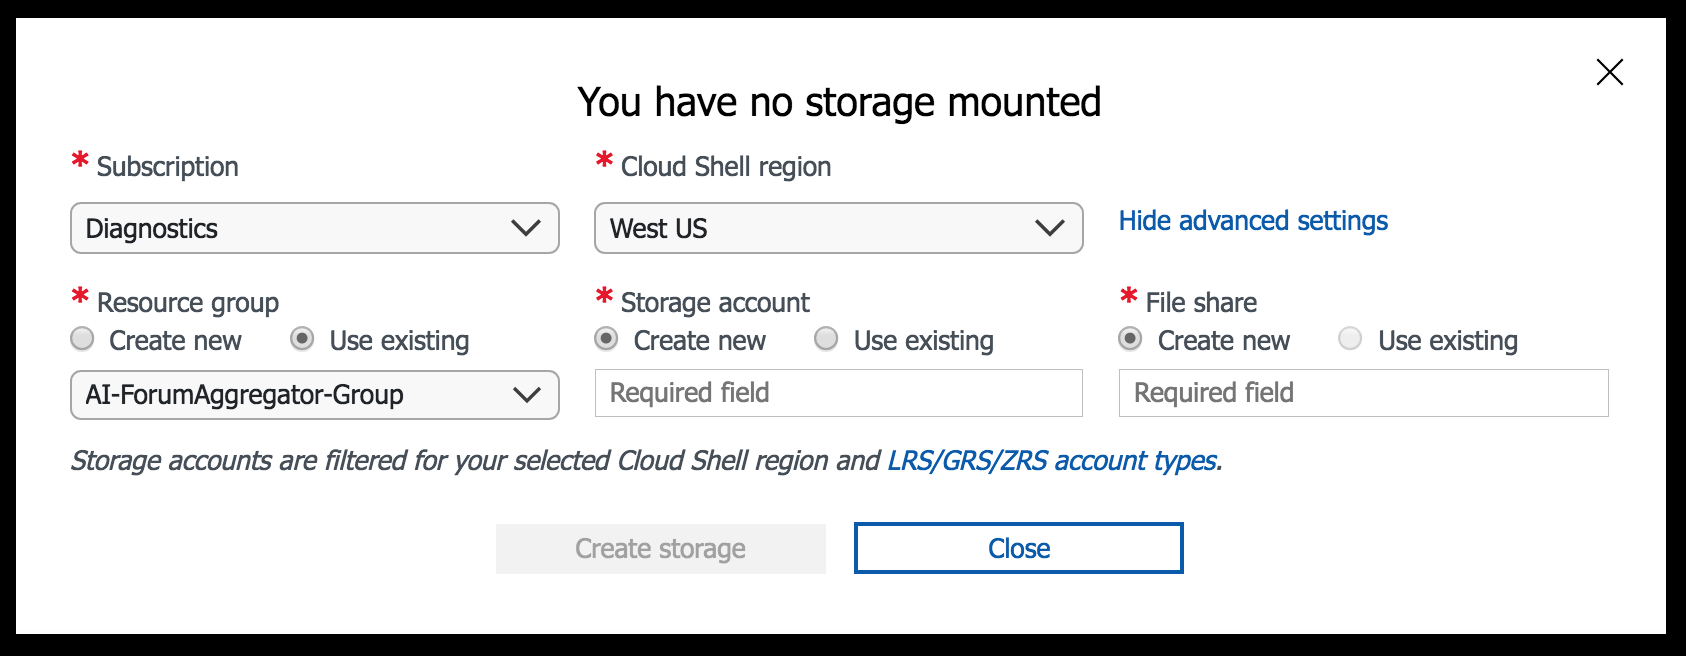
By using the advanced configuration option, you can associate existing resources or create new ones for the Cloud Shell. When selecting a Cloud Shell region you must select a backing storage account co-located in the same region. Ensure that the region is same as the one you’re testing the data locality for.
Once Cloud Shell is configured you will be logged in and the console should be available.
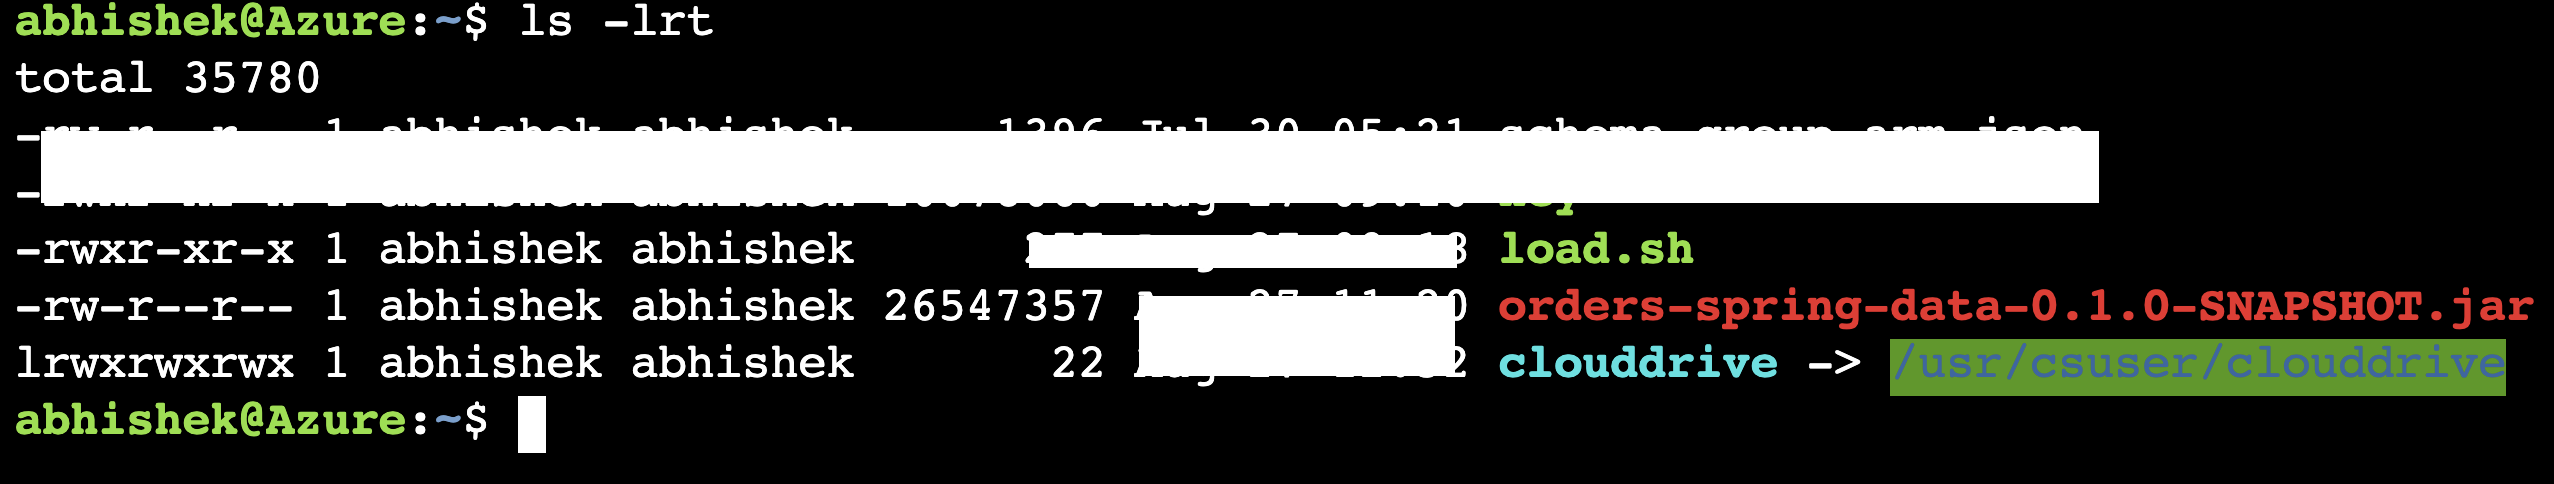
To start with, you will beed to upload the following files:
- The
orders-spring-data-0.1.0-SNAPSHOT.jarfile (intargetfolder), and - Testing script -
load.shfile
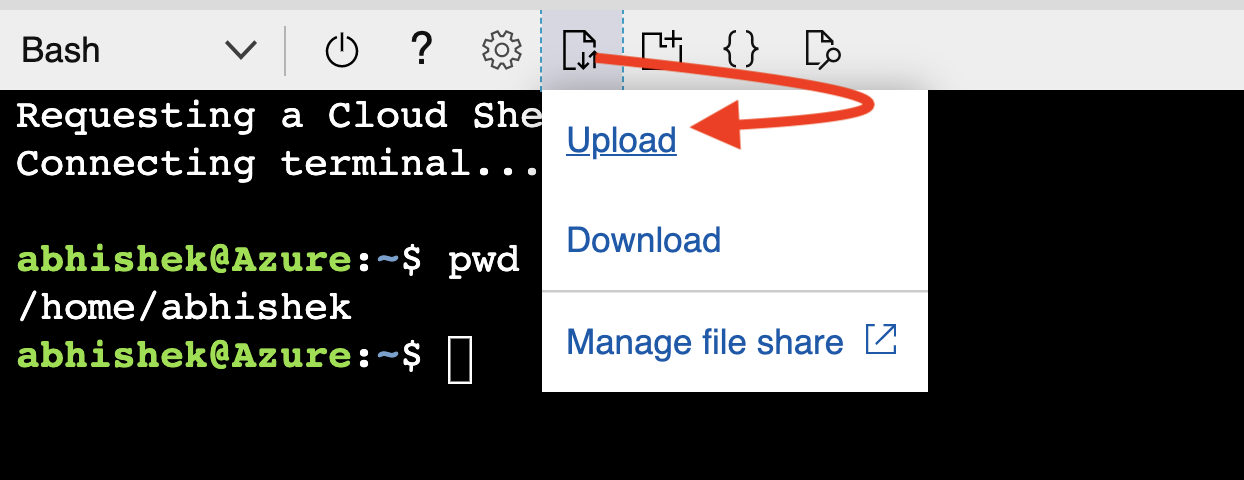
Initiate the file upload and select the files:
Once complete, you can confirm (ls -lrt):
Test data locality
Set the JAVA_HOME env variable and start the application
export JAVA_HOME=/usr/lib/jvm/zulu-8-azure-amd64/
java -jar -Dserver.port=9090 orders-spring-data-0.1.0-SNAPSHOT.jar
Note that we’re using port
9090(and not the default8080port since its not available in Cloud Shell environment)
Start another shell session (from a different browser tab) and initiate the testing script:
chmod a+x load.sh

./load.sh

(press ctrl+c to stop the script)
In the application logs, you should an output similar to this:
*******Stats START********
data center - East US
address - 104.45.144.73
Added order ID a10285b0-e856-11ea-86b0-5d0c82b66df0
query - INSERT INTO orders (amount,id,location,time) VALUES ('42',a10285b0-e856-11ea-86b0-5d0c82b66df0,'foo','2020-08-27T11:15:35.436Z');
latency (in ms) - 8
*******Stats END********
*******Stats START********
data center - East US
Added order ID a431f3b0-e856-11ea-86b0-5d0c82b66df0
address - 104.45.144.73
query - INSERT INTO orders (amount,id,location,time) VALUES ('42',a431f3b0-e856-11ea-86b0-5d0c82b66df0,'foo','2020-08-27T11:15:40.779Z');
latency (in ms) - 7
*******Stats END********
*******Stats START********
data center - East US
address - 104.45.144.73
Added order ID a73e2240-e856-11ea-86b0-5d0c82b66df0
query - INSERT INTO orders (amount,id,location,time) VALUES ('42',a73e2240-e856-11ea-86b0-5d0c82b66df0,'foo','2020-08-27T11:15:45.892Z');
latency (in ms) - 7
*******Stats END********
*******Stats START********
data center - East US
Added order ID aa4b1420-e856-11ea-86b0-5d0c82b66df0
address - 104.45.144.73
query - INSERT INTO orders (amount,id,location,time) VALUES ('42',aa4b1420-e856-11ea-86b0-5d0c82b66df0,'foo','2020-08-27T11:15:51.010Z');
latency (in ms) - 9
*******Stats END********
......
Notice the single digit latency (in millisecond). This is because you’re (the client application) executing writes from the the same region as the data center that you had configured for Write operations.
Try out the same scenario from you local machine. The overall latency will still be small, but not as low as the previous numbers
Conclusion
If this is your final lab, follow the steps in Removing Lab Assets to remove all lab resources.
Additional Resources
- https://github.com/Azure-Samples/azure-cosmos-cassandra-java-retry-sample
- https://docs.microsoft.com/en-us/azure/cosmos-db/cassandra-support#usage-of-cassandra-retry-connection-policy
- https://docs.microsoft.com/en-us/azure/cosmos-db/manage-scale-cassandra
- https://github.com/Azure-Samples/azure-cosmos-cassandra-java-retry-sample
- https://docs.microsoft.com/en-us/azure/cosmos-db/high-availability